Every single module and tool in DrCoder explained with authentic desktop UI screenshots, actual command paths, and safe step-by-step procedures.
Learn how to activate developer options, pair over Wi-Fi, and manage multiple concurrent device targets without serial collisions.
On your phone, navigate to Settings → About Phone and tap Build Number 7 times continuously until you see the prompt "You are now a developer!"
Open System → Developer Options and toggle USB Debugging to ON. On Xiaomi / MIUI / HyperOS devices, also toggle USB Debugging (Security settings) to allow touch input injection.
Connect your phone via USB. A prompt "Allow USB debugging?" will pop up. Check "Always allow from this computer" and tap Allow.
DrCoder auto-detects all connected phones (USB & Wi-Fi). Use the top-bar dropdown to switch targets. All commands are strictly scoped with -s <serial> to eliminate crosstalk.
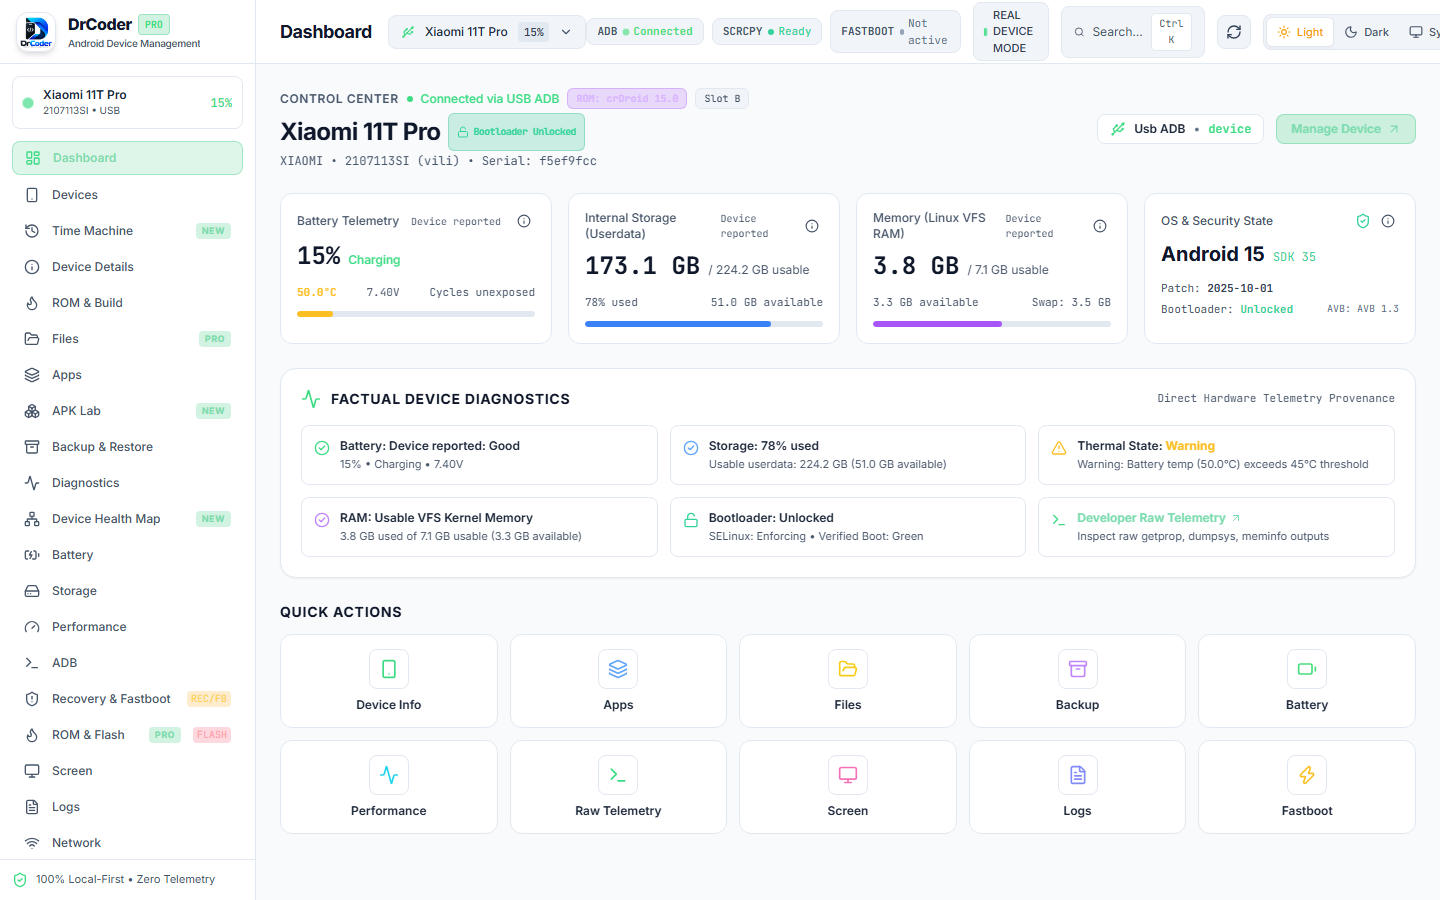 Dashboard & Device Overview
Stream your phone screen at ultra-smooth 60 frames per second with keyboard, mouse, and audio passthrough.
Click Screen in the DrCoder sidebar or click the Mirror Screen quick action badge on the dashboard. DrCoder launches a zero-latency hardware-accelerated scrcpy session.
Click, scroll, and drag directly inside the viewport. Keyboard strokes are piped directly into text fields without needing on-screen keyboards.
Keep your phone physically dark while working on your desktop by toggling Screen-Off Control. This saves battery and prevents phone overheating during prolonged sessions.
Click Start Record to record continuous 60 FPS MP4 video directly to your desktop workstation with synchronized device audio forwarding.
Ctrl (or Cmd on macOS) while dragging the mouse cursor to perform smooth two-finger pinch-to-zoom gestures.
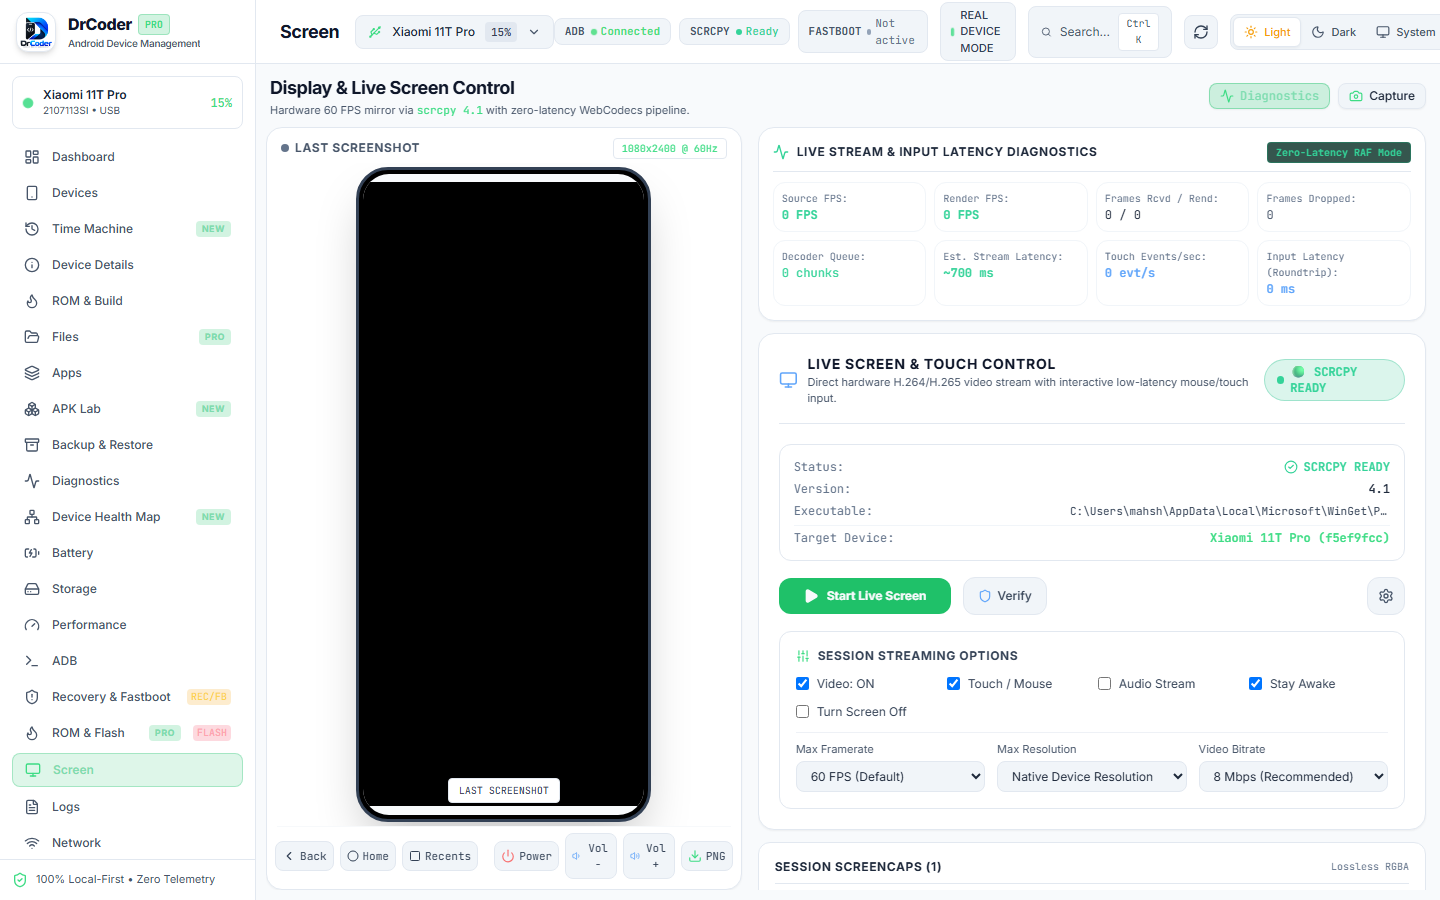 60 FPS Scrcpy Screen Mirroring
Direct Fastboot operations, active A/B slot switching, and non-permanent recovery execution.
With your device connected in ADB mode, click Reboot to Fastboot in the quick actions menu, or hold Volume Down + Power while powering on.
DrCoder auto-detects the Fastboot connection and parses all hardware variables: active slot (current-slot), bootloader version, product codename, secure boot status, and partition types.
If your device gets stuck on a bad OTA update in Slot A, use DrCoder's Active Slot Switcher to switch to Slot B with a single click and reboot back into a working system.
Instead of overwriting your stock recovery partition, click Boot Temporary Image to test TWRP or custom kernels in RAM. If anything fails, a simple phone reboot returns everything to stock!
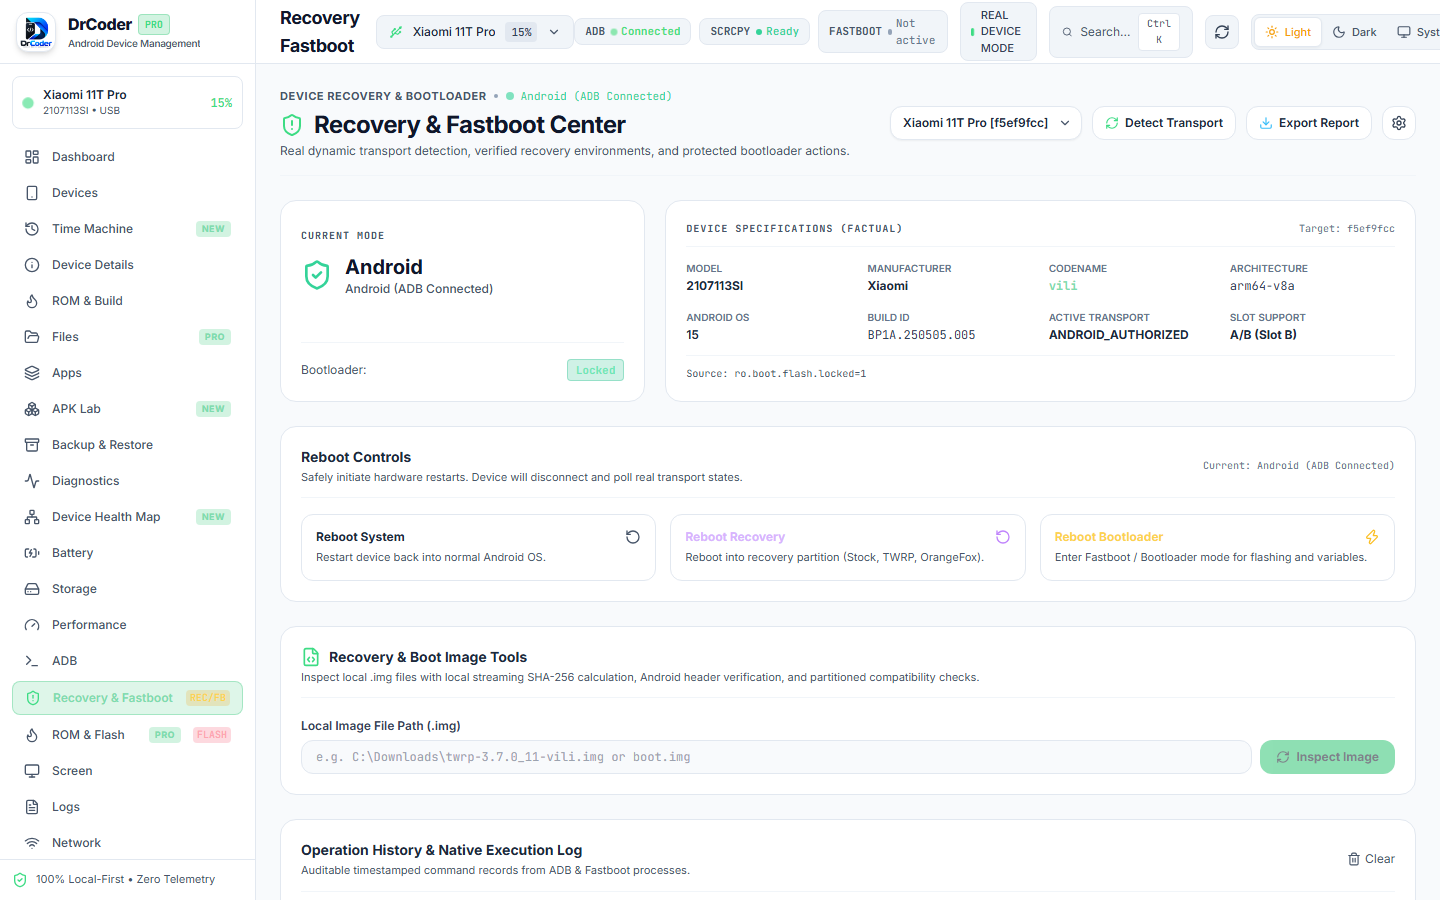 Recovery & Fastboot Center
How to unpack OTA packages, extract boot/vbmeta images, and safely flash devices without risk of bricks.
In the ROM & Flash tab, select your target device and drag your official firmware archive (.zip, payload.bin, or raw .img partition files) into the inspection zone.
DrCoder streams through the package in real-time, verifying Android Verified Boot (AVB0), image magic headers (ANDROID!), partition sizes, and device codename compatibility.
Always click Run Dry Run Simulation first. DrCoder tests the full execution plan against virtual partition tables to confirm zero write errors occur before actual flashing.
To flash physical hardware, DrCoder enforces typing FLASH DEVICE and holds an automatic 3-second safety delay timer to eliminate accidental clicks.
unlocked: no), preventing irreversible boot loops.
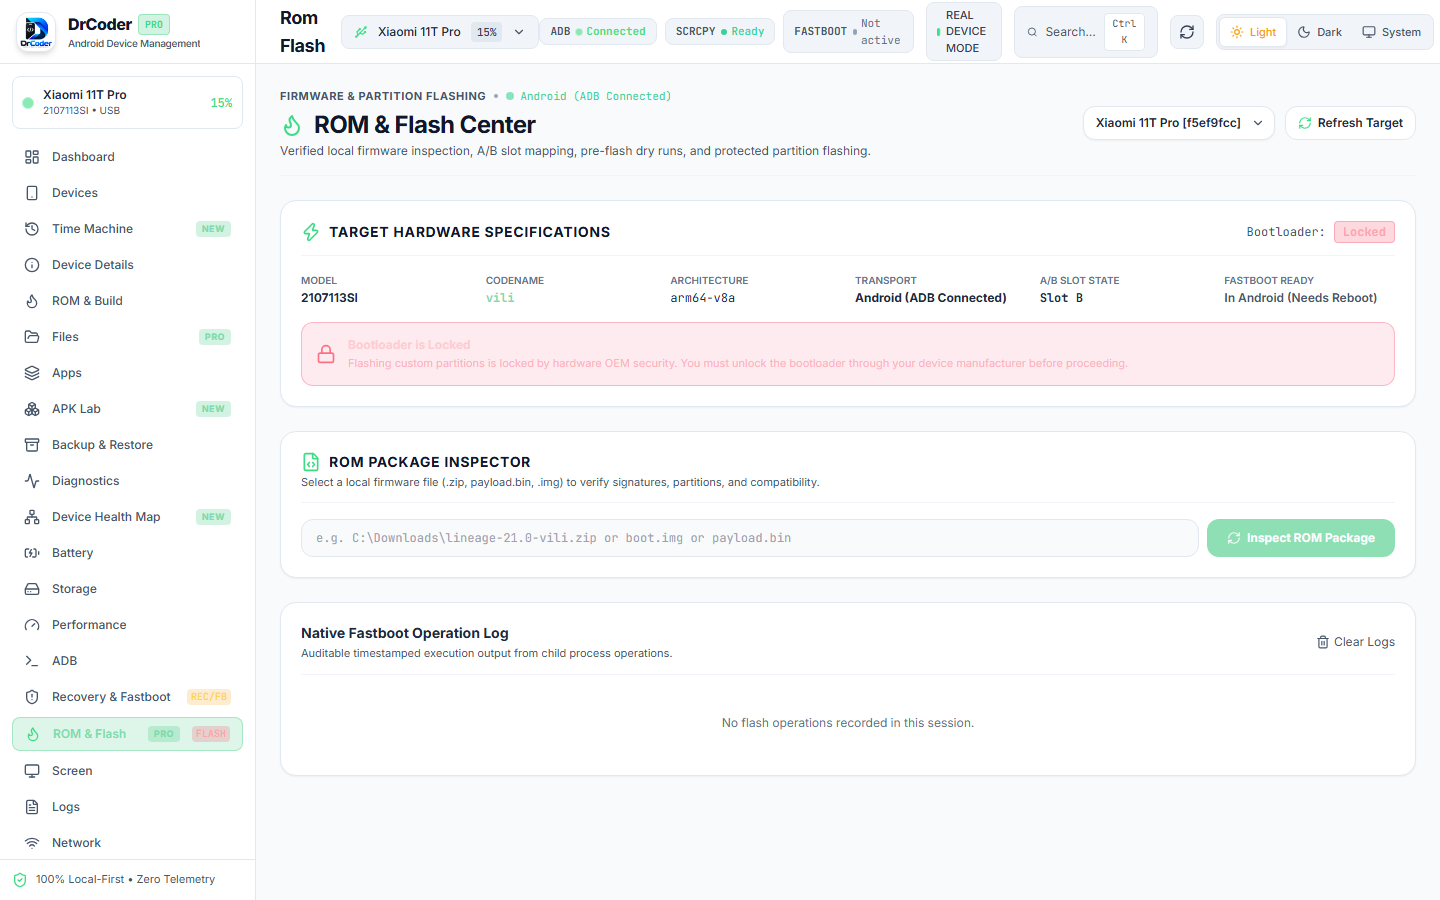 ROM & Flash Workstation
Detect battery degradation, analyze CPU governor frequencies, identify throttling zones, and inspect crash buffers.
DrCoder parses real OEM kernel values (/sys/class/power_supply/battery). Inspect authentic battery temperature (°C), live millivolts (mV), charge cycle counters, and current draw (mA).
Inspect active thermal zones (thermalservice). If your device is throttling during gaming or charging, DrCoder highlights the exact thermal zone causing CPU downclocking.
Inspect Android's crash buffer (logcat -b crash -d) without scrolling through millions of verbose lines. All native SIGSEGV errors and Java stack traces are summarized clearly.
Generate certified hardware audit certificates in TXT or JSON format. Sensitive serial numbers and MAC addresses are automatically masked for customer sharing.
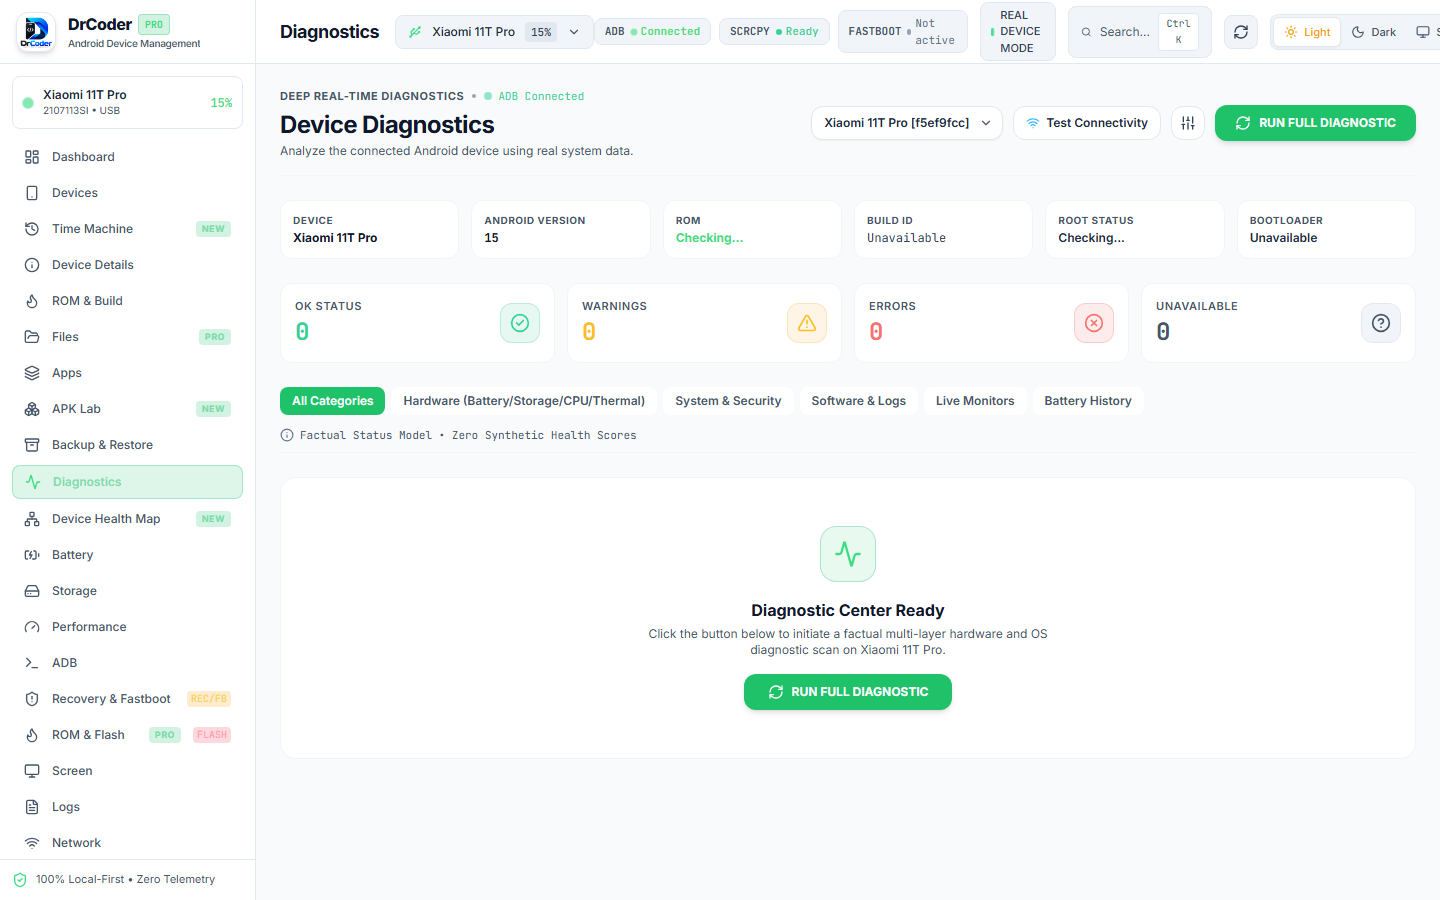 Comprehensive Diagnostic Scan
Monitor multi-core governor frequencies, Gfxinfo framestats, memory utilization, and active running processes.
Inspect live clock speeds for efficiency, performance, and prime CPU cores in real-time directly from /sys/devices/system/cpu/cpu*/cpufreq/scaling_cur_freq.
Monitor real rendering metrics for active apps: total frames rendered, 90th percentile frame time, jank percentage, and missed VSYNC signals.
Audit running background packages sorted by RAM and CPU consumption. Detect rogue apps causing background drain.
Watch historical rolling charts of CPU, memory, and thermal variations while running demanding games or stress tests on the phone.
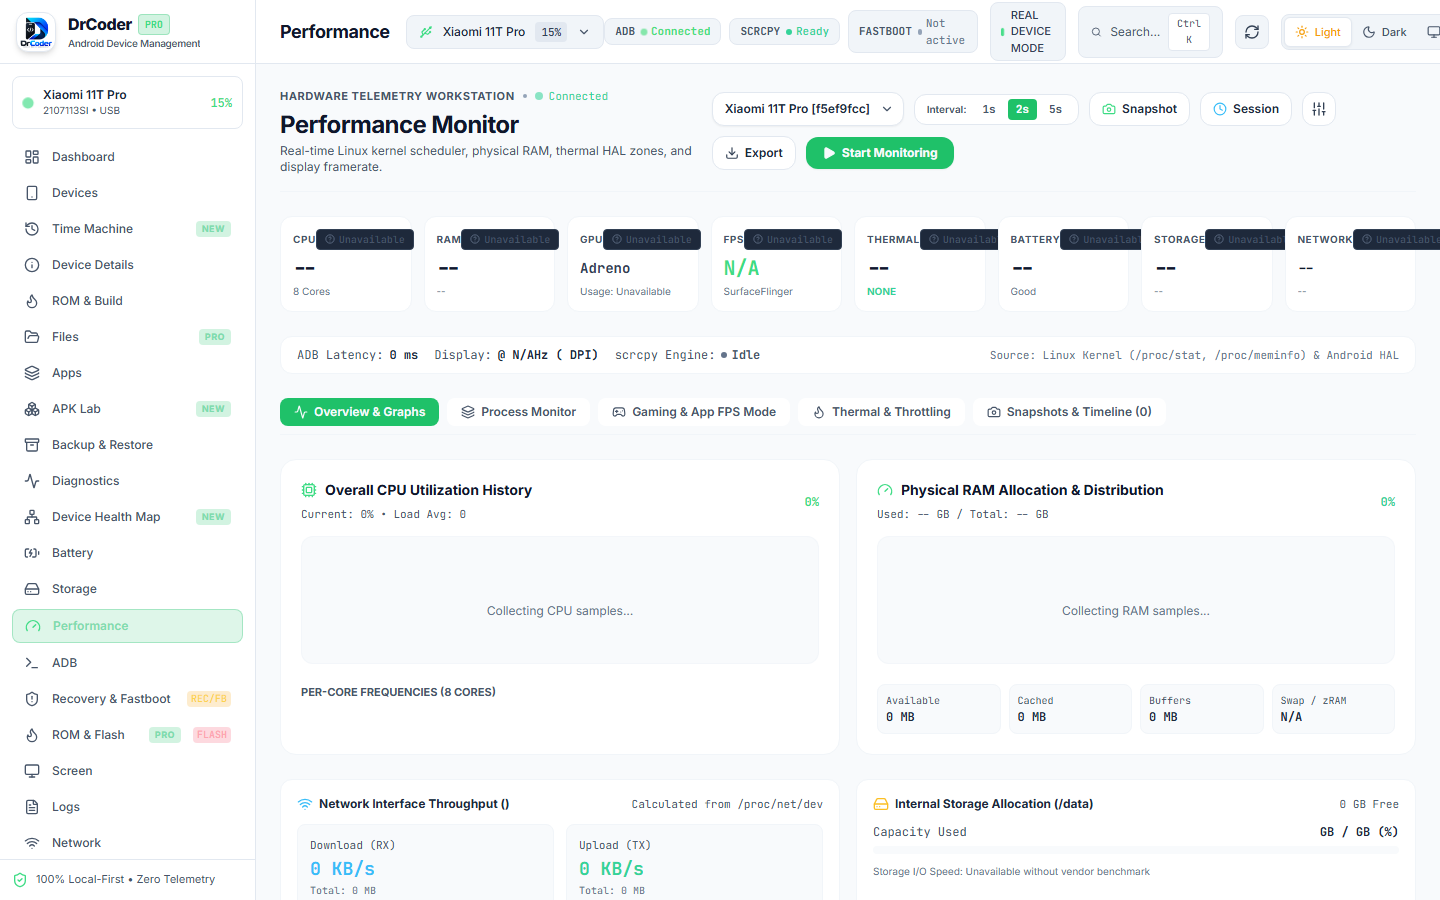 Real-Time Performance Monitor
Execute shell commands, run pre-built diagnostic macros, and inspect stdout/stderr without dealing with terminal quirks.
Run single commands or interactive shell sessions. DrCoder auto-injects -s <serial> so your commands always hit the correct target phone.
Access pre-configured shortcuts for common tasks: dumpsys battery, wm size 1080x2400, wm density 440, pm clear <package>, and getprop.
Review clear execution latency (in milliseconds) with distinct green stdout outputs and highlighted red stderr messages.
Quickly search past commands using up/down arrow keys or export the full command log to a text file for documentation.
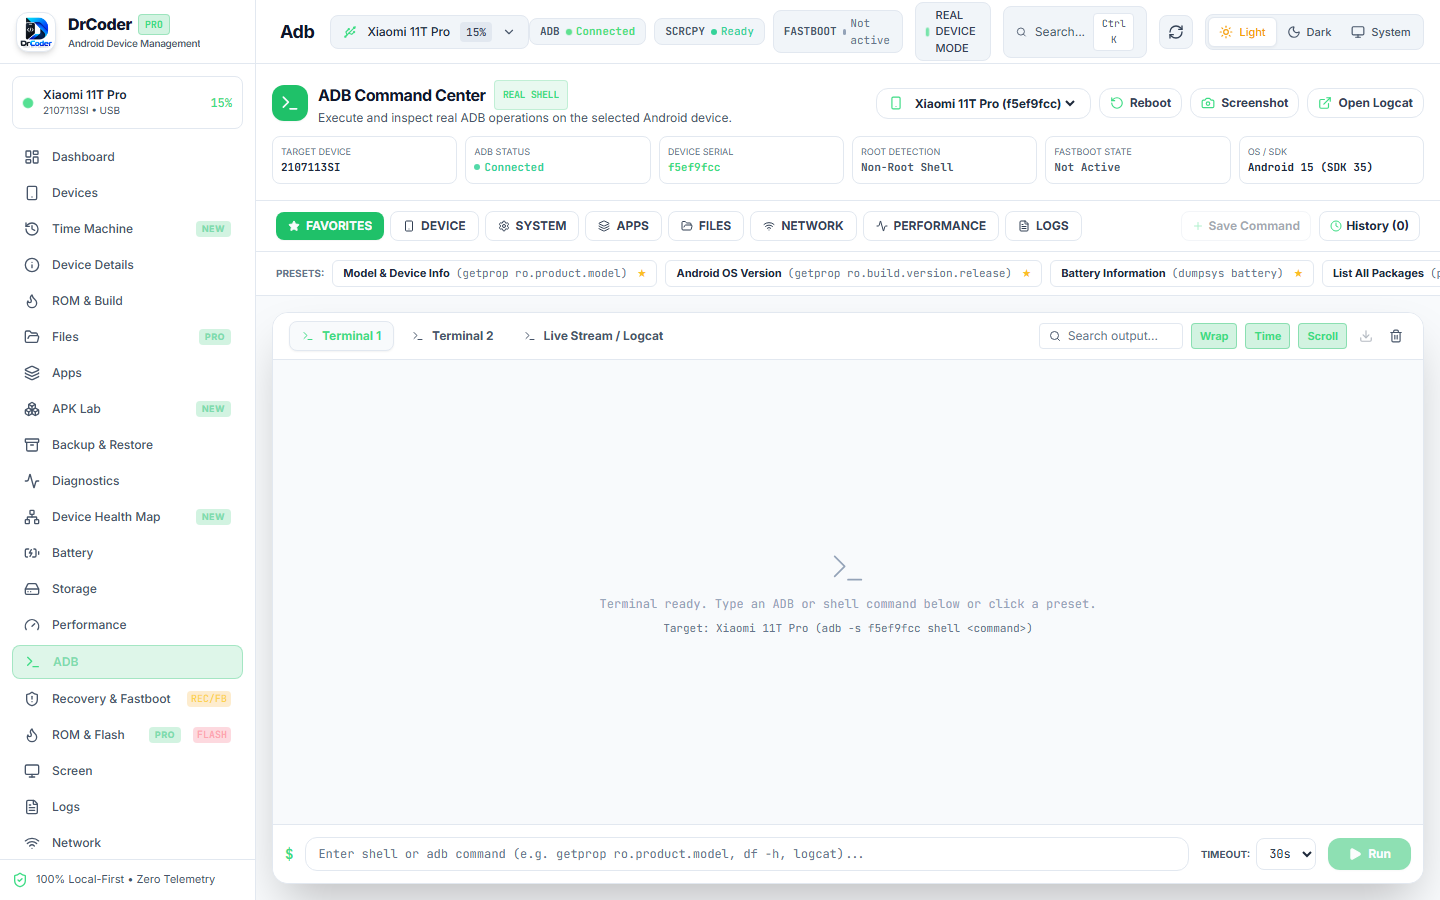 ADB Command Center & Terminal
Browse internal flash storage and root directories with high-speed streaming transfers, chmod permissions editing, and batch file handling.
Side-by-side explorer showing your computer's local directories on one side and Android storage (/sdcard, /storage/emulated/0) on the other.
Drag files or entire directories between panes. Uses chunked ADB streaming pipelines with real-time transfer progress and MB/s speedometers.
On rooted devices, right-click any file to inspect and modify Unix permissions (e.g. rwxr-xr-x 0755) directly in the UI.
One-click shortcuts to DCIM Camera photos, Downloads, WhatsApp Media, Android/data, and root system directories.
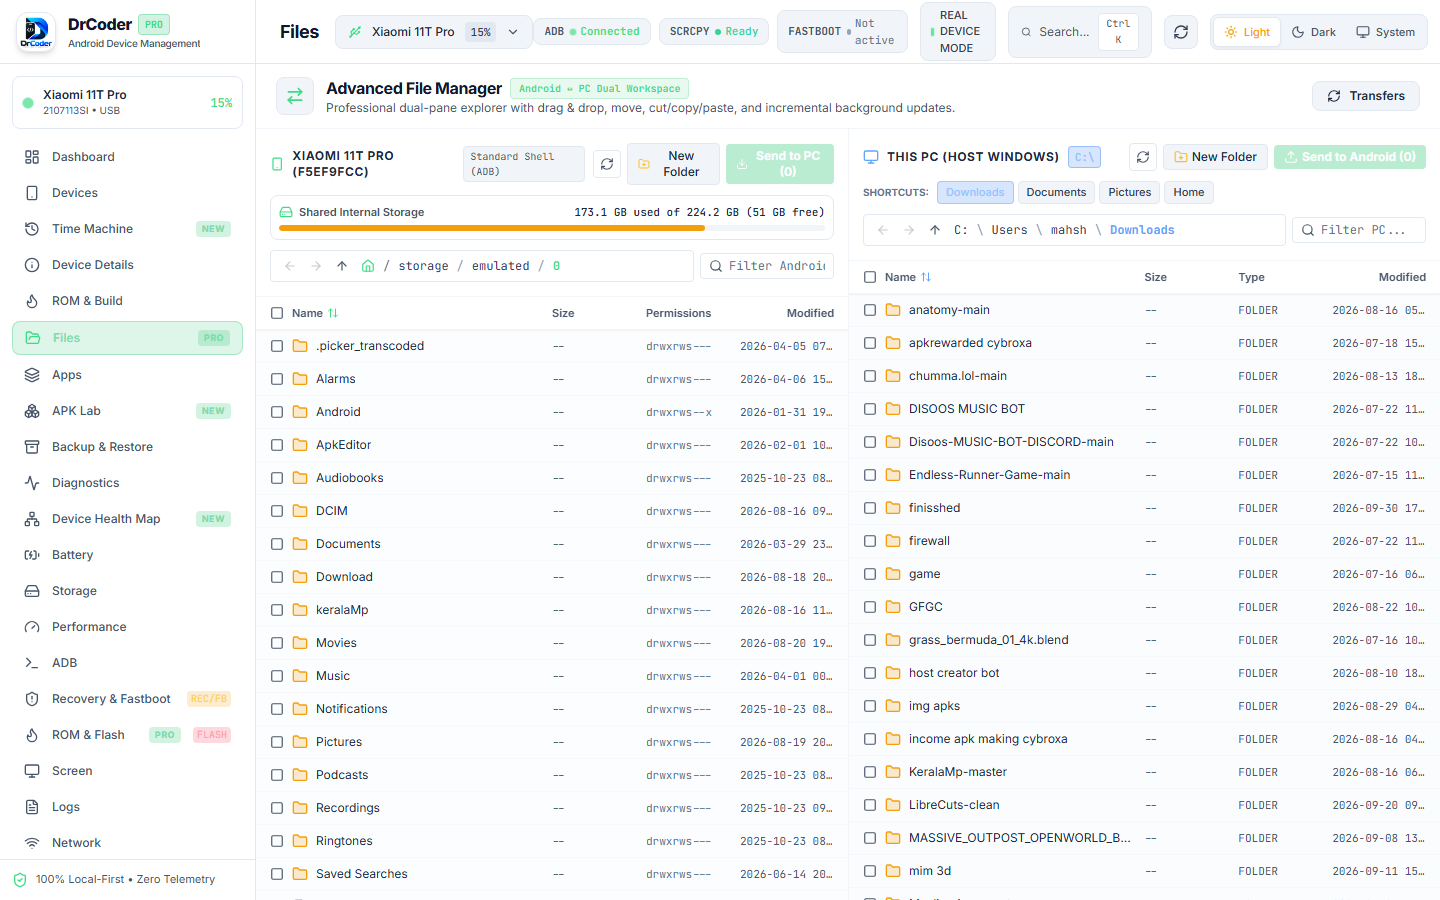 Advanced Two-Pane File Manager
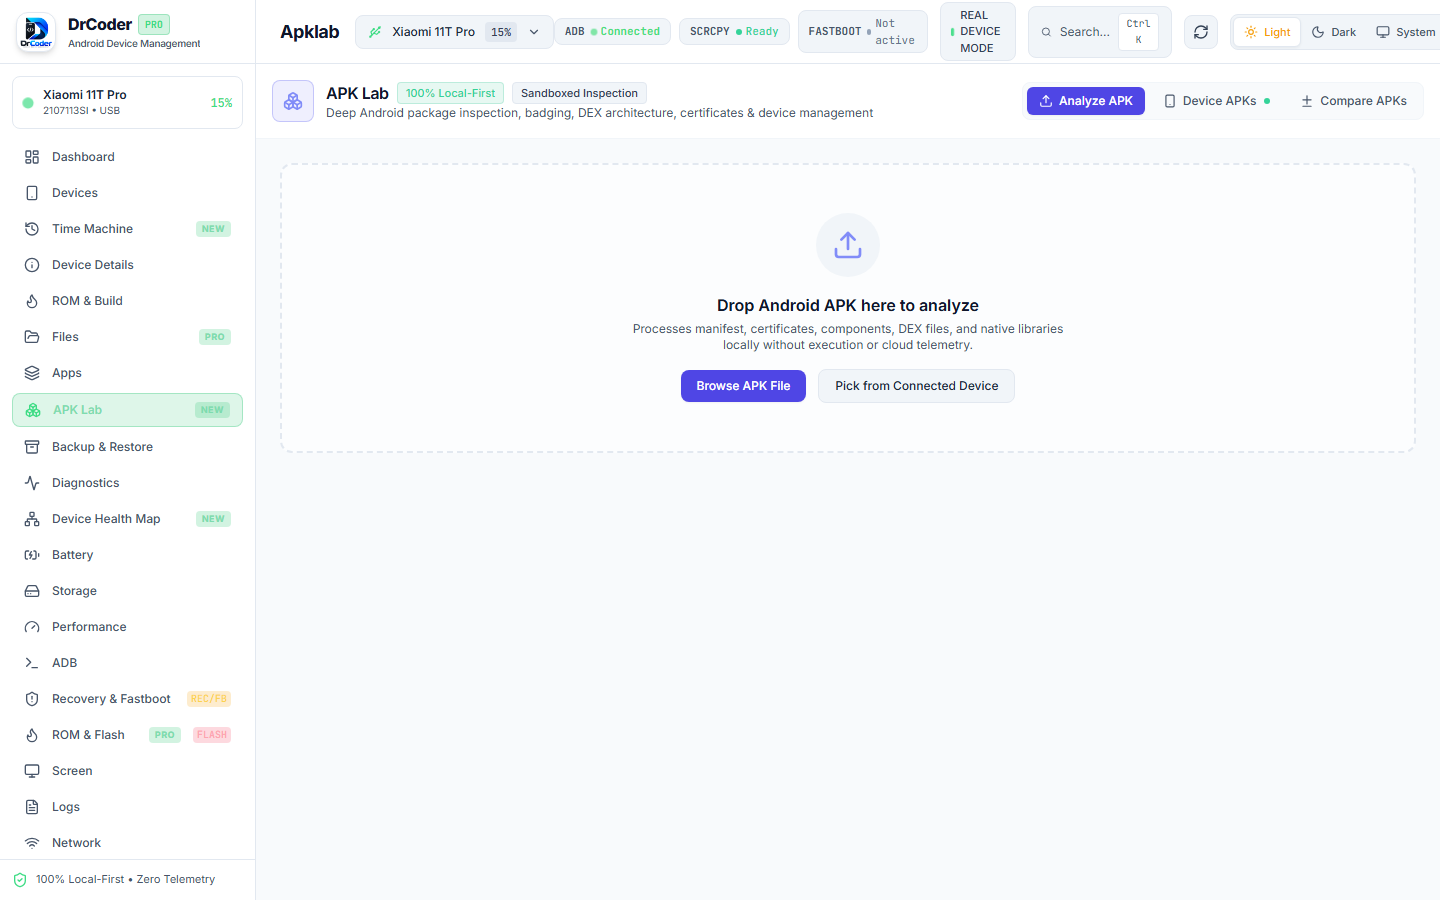
Audit AndroidManifest.xml, inspect dangerous runtime permissions, extract installed APKs, and install APKS/XAPK split bundles.
Inspect minSdk, targetSdk, package activities, services, broadcast receivers, and declared permissions before installing any unknown APK.
Modern Google Play apps are distributed as split base and config architectures. DrCoder automatically handles split APK bundling and installs them cleanly via pm install-create.
Extract any system or user APK installed on your device with a single click. Back it up to your workstation or inspect its signing certificate.
Safely disable or hide OEM bloatware apps (pm disable-user --user 0) without requiring root, freeing up RAM and battery.
 APK Lab & Inspector
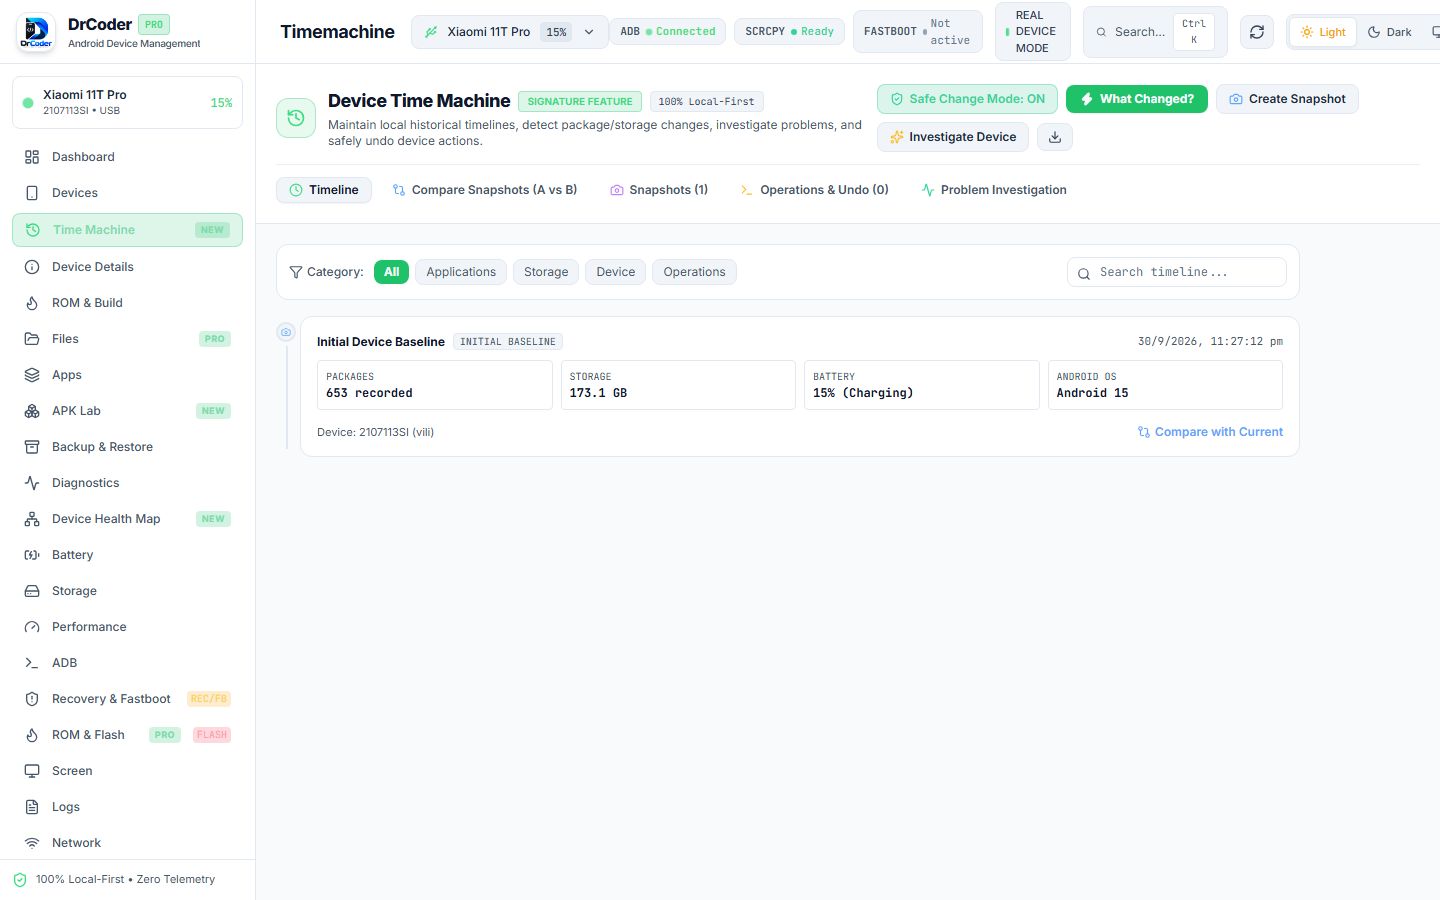
Maintain local historical baselines, detect package and storage modifications, investigate system regressions, and safely rollback device actions.
When you connect your phone, DrCoder automatically captures a baseline: recorded package count (e.g. 653 packages), used internal storage, battery status, and Android OS version.
Before installing custom ROMs, flashing modules, or granting permissions, click Create Snapshot. Enter a label (e.g. "Pre-Update Clean State") to capture full system state.
Switch to the Compare Snapshots tab to diff any two timeline states. Highlight newly added APKs, modified storage directories, or changed system settings.
Review the chronological log of all ADB, package, and file operations executed on the device, with one-click undo capability to reverse actions safely.
 Device Time Machine Interface
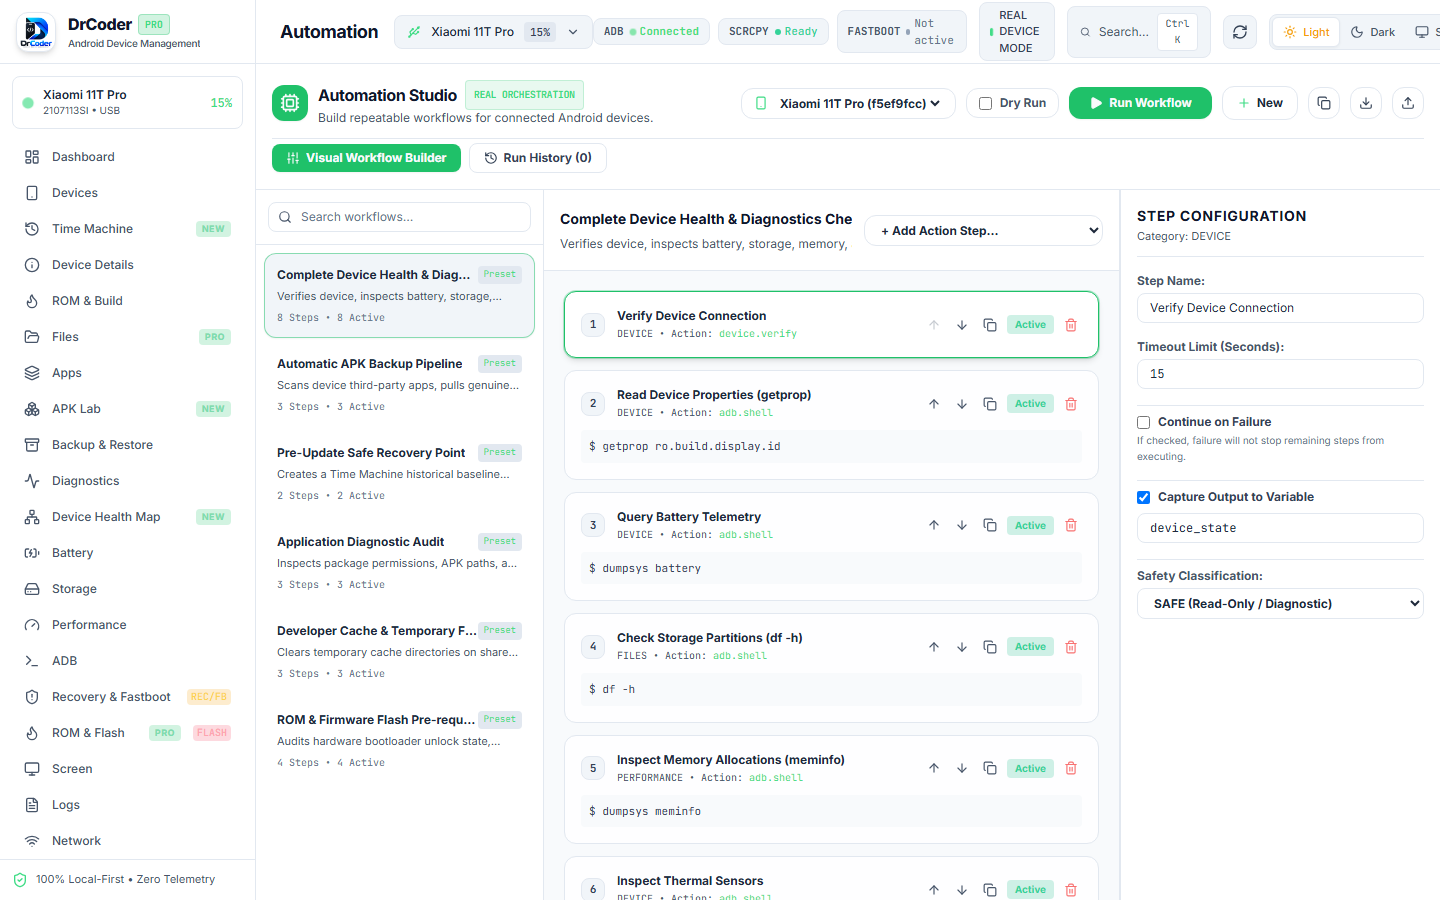
Chain multiple device actions, automated test scripts, and provisioning workflows into reusable visual execution pipelines.
Combine actions like: Verify Device Connection → Read Device Properties → Query Battery Telemetry → Check Storage Partitions → Inspect Memory into a single one-click workflow.
Add conditional checkpoints: if device battery is below 20%, halt execution; if package fails verification, automatically roll back.
Toggle Dry Run to simulate execution without sending commands to physical hardware, verifying syntax and variables safely.
Export your pipelines as clean JSON files to version control them in Git or share them across your development team.
 Automation Studio Pipeline Builder
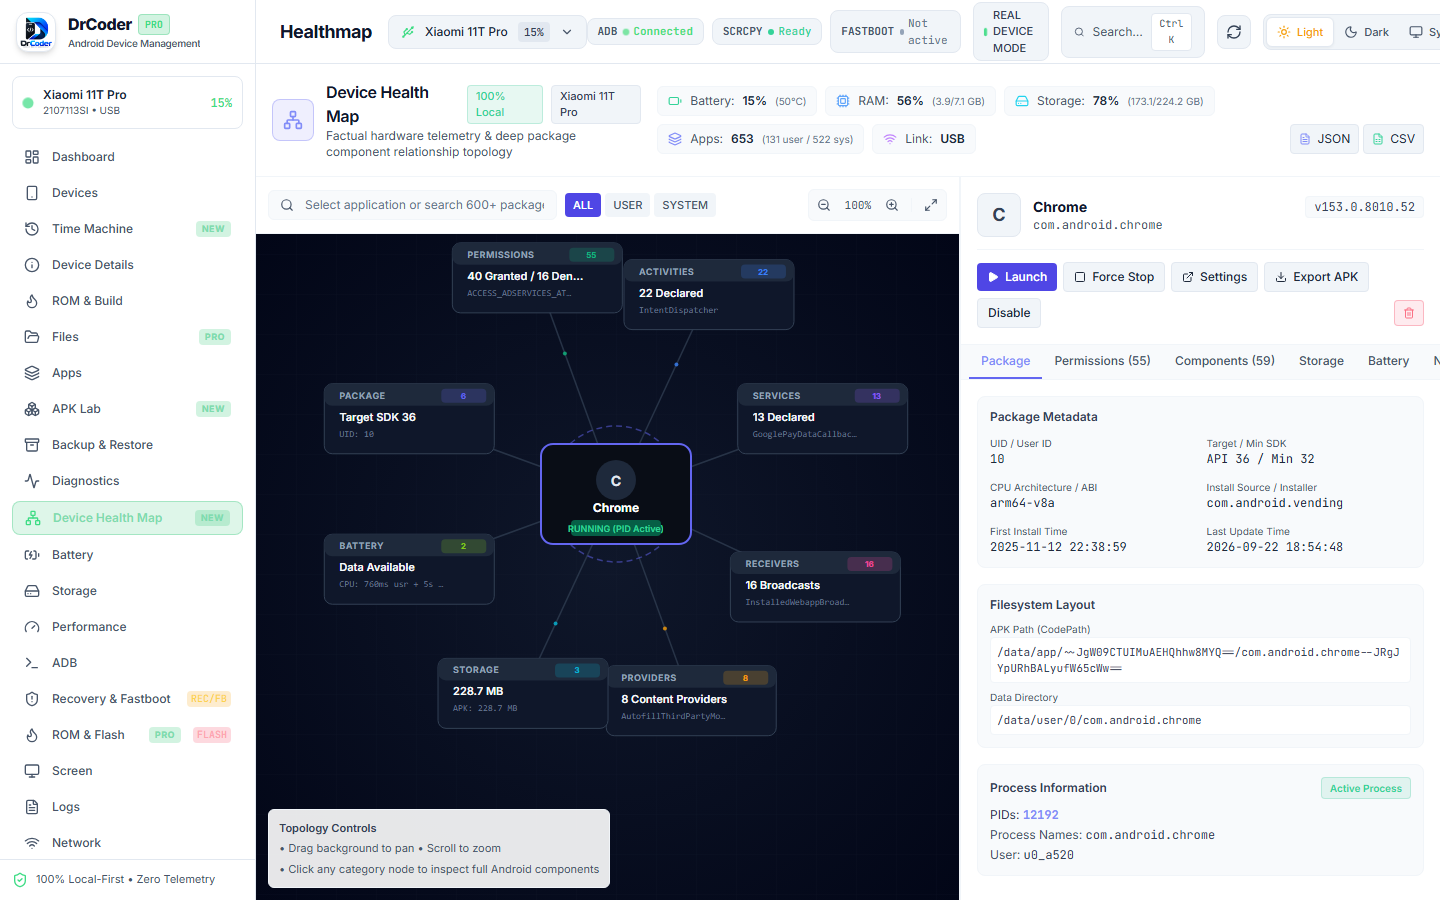
Visualize application architecture, declared components (services, receivers, activities, providers), permissions, and process telemetry in an interactive topology node map.
Explore the connected visual tree: central application node branches out to declared activities, background services, broadcast receivers, and content providers.
Inspect exact permission counts (e.g. 40 granted / 16 denied) with access details (ACCESS_ADSERVICES_ATTRIBUTION, location, storage) at a glance.
Monitor active PIDs, Linux user ID (u0_a520), native CPU architecture (arm64-v8a), code path (/data/app/...), and data directories.
Directly Launch, Force Stop, Disable bloatware, or Export full application metadata in structured JSON or CSV format.
 Device Health Map & Topology